TAHOPE_CWB_data_demonstration
The below demonstrates the elegent way to acess CWB data in TAIHOPE project through python-based tools( i.e. cwbplot module)
For more detail information, please see:https://cwbplot.readthedocs.io/en/dev/ (under construction)
[1]:
##import CWB developed module
import cwbplot.IO_tools as IO
[2]:
##import python utility module
import numpy as np
from mpl_toolkits.basemap import Basemap
import matplotlib.pyplot as plt
import warnings
warnings.filterwarnings('ignore')
MSC satellite data
[3]:
#1. Given MSC data file path, no need for untar.
file_twn='DATA/MSC_SAT/2022-03-21_0900.TAIWAN_NWP.VIS.1350.tar.gz'
file_asia='DATA/MSC_SAT/2022-03-21_0900.EASTASIA_NWP.IR1.2750.tar.gz'
#2 Using MSC_READ function and get data object, the info shows data contain albedo(alb),
#   grayscale value(cnt), and brightnes temperature(btp)
taiwan_obj=IO.MSC_READ(file_twn)
asia_obj = IO.MSC_READ(file_asia)
#3 all data info are in this structured object
<TarInfo '2022-03-21_0900.TAIWAN_NWP.VIS.1350.alb' at 0x7fe9999684f8>
<TarInfo '2022-03-21_0900.TAIWAN_NWP.VIS.1350.Cnt' at 0x7fe9999685c0>
<TarInfo '2022-03-21_0900.EASTASIA_NWP.IR1.2750.btp' at 0x7fe9999685c0>
<TarInfo '2022-03-21_0900.EASTASIA_NWP.IR1.2750.Cnt' at 0x7fe9999684f8>
[4]:
## Projection for TAWINAN AREA
bm_twn = Basemap(projection='tmerc', resolution='i',lat_0=23.7,lon_0=121.0,\
            llcrnrlon=116.1417,llcrnrlat=19.0295,urcrnrlon=126.2109,urcrnrlat=28.2065)

## Projection for EASTASIA
bm_asia = Basemap(projection='lcc', resolution='i',\
            lat_1=30.,lat_2=60.,lat_0=0,lon_0=128.5,\
            llcrnrlon=102.111,llcrnrlat=-1.503,\
             urcrnrlon=155.270,urcrnrlat= 48.589)
[5]:
bm_twn.pcolormesh(taiwan_obj.lon ,taiwan_obj.lat,taiwan_obj.data['VIS_ALB'],cmap='binary_r',latlon=True)
bm_twn.drawcoastlines(color='w')
plt.colorbar()
plt.title('TAIWAN AREA ALEBDO for VIS BAND AT 0900 LST')
[5]:
Text(0.5, 1.0, 'TAIWAN AREA ALEBDO for VIS BAND AT 0900 LST')

[6]:
bm_asia.pcolormesh(asia_obj.lon ,asia_obj.lat,asia_obj.data['IR1_BTP'],cmap='hsv',latlon=True)
bm_asia.drawcoastlines(color='w')
bm_asia.drawparallels(np.arange(0,60,10) , labels=[1,0,0,0] , fontsize=10,color='w')
bm_asia.drawmeridians(np.arange(80,180,10),labels=[0,0,0,1],fontsize=10,color='w')
plt.colorbar()
plt.title('EASTASIA AREA Bnt for IR BAND AT 0900 LST')
[6]:
Text(0.5, 1.0, 'EASTASIA AREA Bnt for IR BAND AT 0900 LST')

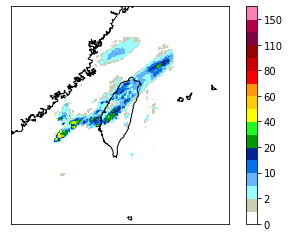
Max combine Radar Reflectivity
[7]:
##Note that function "COMPREF_READ" can recognized both radar reflectivity and QPE data
compress_dat='DATA/RADAR/COMPREF.20220321.0000.gz'
out=IO.COMPREF_READ(compress_dat)
bm_twn.drawcoastlines()
bm_twn.contourf(out.lon,out.lat,out(),**out.cwbcolorbar(),latlon=True)
plt.colorbar()
print(out)
unzip files
CWB CREF binary format([('', '<i2')])
TIME:Mon Mar 21 00:00:00 2022
DIMX,DIMY,DIMZ=921,881,1

Radar QPE
[8]:
qpe_dat='DATA/qpe/CB_GC_PCP_1H_RAD.20220328.0000.gz'
out=IO.COMPREF_READ(qpe_dat)
bm_twn.drawcoastlines()
bm_twn.contourf(out.lon,out.lat,out(),**out.cwbcolorbar(),latlon=True)
plt.colorbar()
print(out)
unzip files
CWB QPE binary format([('', '<i2')])
TIME:Mon Mar 28 00:00:00 2022
DIMX,DIMY,DIMZ=441,561,1
Numerical model data (DMSKEY)
DMSKEY NAMING:[LEVEL]+[FIELDS]+[DOMAIN] (3-digits for each elements)
- LEVEL:
850 means 850 hPa,
B00 means ground level
- FIELDS:
See Reference DMSKEY(1)
For more detials for combinations of LEVEL and FIELDS, see Referecne DMSKEY(2)
- DOMAIN:
WD01: 15km resolution
WD02: 3-km resolution
WF02: 3-km but only Taiwan area
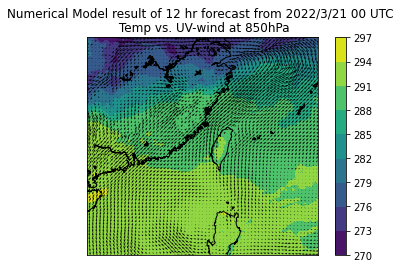
The demstration below shows the u,v wind and temperature at 850 hPa in 3km resolution domain(WD02).
[9]:
def DMSXYDIM(WXX):
    ''' function for return xdim,ydim at once
        EX: xdim,ydim=DMSXYDIM("WF02")
    '''
    if WXX=='WD01': xdim,ydim=661,385
    if WXX=='WD02': xdim,ydim=1158,673
    if WXX=='WF02': xdim,ydim=263,303
    if WXX=='WE01': xdim,ydim=450,450
    return xdim,ydim

def DMSTAIL(WXX):
    ''' function for return tail of DMSKEY in string format
    '''
    domain2grid={"WD01":"0254485" ,"WD02":"0779334" ,"WF02":"0079689","WD03":"0729136","WE01":"0202500"}
    return domain2grid[WXX]

file_path='/IFS6/data2/datarfs/c164/test/2022032100000012/'
#### 20222032100 means model initial at 2022/03/21 00 UTC
#### 0000012 means forecast time is 12 hour
dms_lat = np.fromfile(file_path+'X00LATWD02H0779334',dtype='>d',count=-1,sep="") #LAT
dms_lon = np.fromfile(file_path+'X00LONWD02H0779334',dtype='>d',count=-1,sep="") #LON
dms_u = np.fromfile(file_path+'850200WD02H0779334',dtype='>d',count=-1,sep="")
dms_v = np.fromfile(file_path+'850210WD02H0779334',dtype='>d',count=-1,sep="")
dms_rh = np.fromfile(file_path+'850510WD02H0779334',dtype='>d',count=-1,sep="")
dms_t = np.fromfile(file_path+'850100WD02H0779334',dtype='>d',count=-1,sep="")
xdim,ydim=DMSXYDIM("WD02")
data_lat= np.float32(np.reshape(dms_lat, (xdim,ydim), order='F'))
data_lon= np.float32(np.reshape(dms_lon, (xdim,ydim), order='F'))
data_u= np.float32(np.reshape(dms_u, (xdim,ydim), order='F'))
data_v= np.float32(np.reshape(dms_v, (xdim,ydim), order='F'))
data_rh= np.float32(np.reshape(dms_rh, (xdim,ydim), order='F'))
data_t= np.float32(np.reshape(dms_t, (xdim,ydim), order='F'))
[10]:
bm = Basemap(projection='tmerc',resolution='i', fix_aspect=True, llcrnrlon=110,
             llcrnrlat=15, urcrnrlon=130,urcrnrlat=32,lat_0=45,lon_0=120)
bm.drawcoastlines()
bm.contourf(data_lon,data_lat,data_t,latlon=True)
bm.quiver(data_lon[::10,::10],data_lat[::10,::10],data_u[::10,::10],data_v[::10,::10]
          ,scale=500,latlon=True)
plt.colorbar()
plt.title('Numerical Model result of 12 hr forecast from 2022/3/21 00 UTC \n Temp vs. UV-wind at 850hPa')
[10]:
Text(0.5, 1.0, 'Numerical Model result of 12 hr forecast from 2022/3/21 00 UTC \n Temp vs. UV-wind at 850hPa')
Reference DMSKEY
3D fields at mandatory levels
‘000’ : geopotential height (hPa)
‘100’ : temperature (K)
‘150’ : Dew Point temperature (K)
‘200’ : u (m/s)
‘210’ : v (m/s)
‘220’ : omega (hPa/hr)
‘510’ : RH (%)
‘500’ : q (kg/kg) specifc humidity
‘550’ : ql (kg/kg) (=qc+qrain )liquid water mixing ratio
‘552’ : qice (kg/kg) ice mixing ratio
‘553’ : qrain (kg/kg) rain water mixing ratio
‘554’ : qsnow (kg/kg) snow mixing ratio
‘555’ : qgraup (kg/kg) graupel mixing ratio
‘556’ : qv (kg/kg) water vapor mixing ratio
‘551’ : qc (kg/kg) cloud water mixing ratio
2D fields
‘B00010’ : Terrain surface pressure (hPa)
‘B00100’ : Temperature at model’s lowest sigma level
‘B00150’ : Dew Point Temperature at model’s lowest sigma level
‘B00200’ : u at model’s lowest sigma level
‘B00210’ : v at model’s lowest sigma level
‘B00510’ : RH at model’s lowest sigma level
‘B0062T’ : Total Precipitation (=’B0063T’+’B0064T’)
‘B00620’ : Dmskey defied Precipitation (note: MUST have B0062T as well,and Recommanded to extract all tau to avoid calculated error, otherwise you need to put SPECIFIC TAUs for calculating this key!)
‘B0063T’ : Total Precipitation caused by cumulus parameterization
‘B00630’ : Precipitation caused by cumulus parameterization (note: MUST have B0063T to calculate this key)
‘B0064T’ : Total Precipitation caused by microphysic parameterization
‘B00640’ : Precipitation caused by microphysic parameterization (note: MUST have B0064T to calculate this key)
‘B02100’ : Temperature at 2m Height
‘B02150’ : Dew Point Temperature at 2m height
‘B02510’ : RH at 2m height
‘B10200’ : u at 10m height
‘B10210’ : v at 10m height
‘SSL010’ : Sea level pressure (hPa)
‘S00060’ : Terrain Height
‘S00070’ : Land Sea Mask (Land:1, Sea:0)
‘S000LU’ : Land Use Type (USGS 24 categories)
‘S00100’ : Surface Skin Temperature
‘W00100’ : Sea Surface Temperature (SST)
‘X00LAT’ : Latitude
‘X00MOS’ : Column vector of the radar reflectivity
‘S004F0’ : PBL height
‘B80200’ : U-wind at 80-m above ground level
‘B80210’ : V-wind at 80-m above ground level
‘S00420’ : Sensible heat flux
‘S00430’ : Latent heat flux
‘X00340’ : OLR
‘S00320’ : LongWave radiation flux at surface
‘S00310’ : ShortWave radiation flux at surface
‘X00VEN’ : Ventilation index
‘X00PWV’ : Precipitable water vapor
‘X00CAP’ : CAPE for the parcel with max theta-e in the column
‘X00CIN’ : CIN for the parcel with max theta-e in the column
‘B02500’ : Specific humidity at 2-m height
‘S005C0’ : Canopy water
‘S00431’ : UPWARD MOISTURE FLUX AT THE SURFACE
‘B00REF’ : Radar reflectivity at lowest eta level
‘S004A0’ : U* IN SIMILARITY THEORY
‘S00440’ : GROUND HEAT FLUX
‘B02556’ : mixing ratio at 2-m height
‘B00PFC’ : Surface pressure calculated by using altimeter equation
‘B00623’ : 6hr precipitation