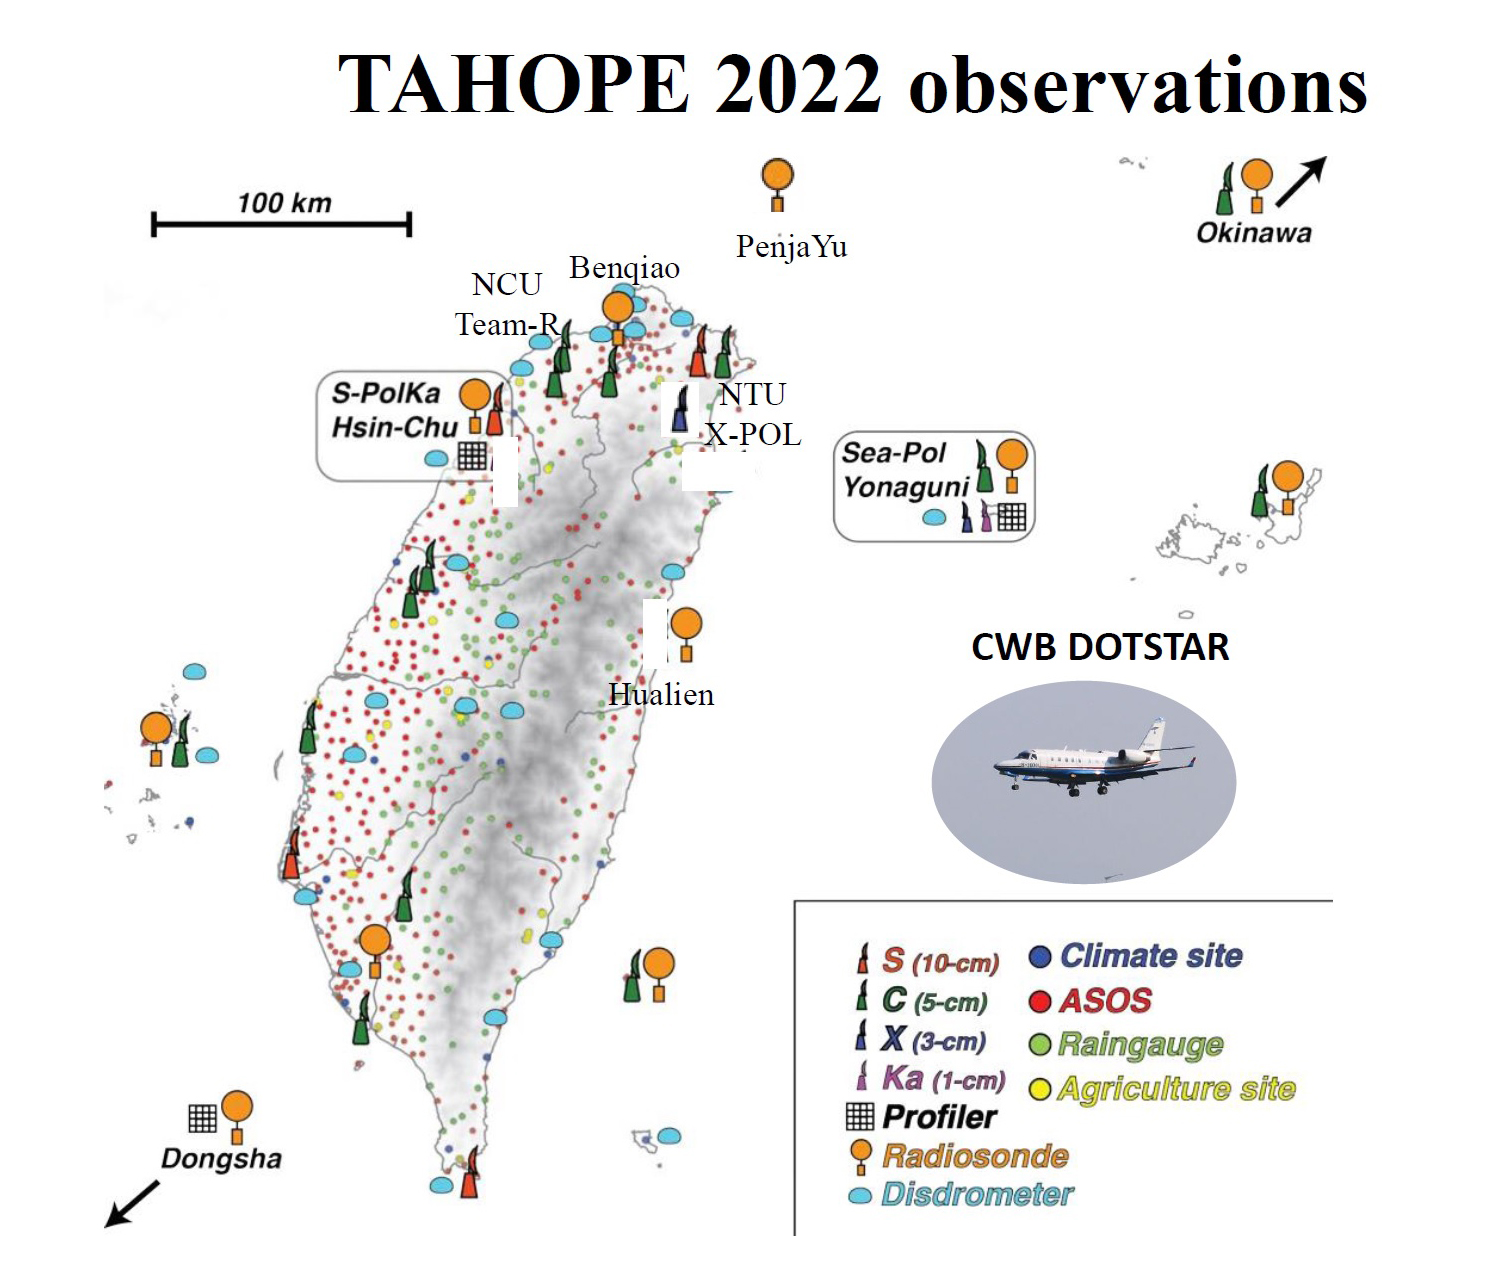
Briefder introduction of TAHOPE observations
The spatial distribution of observation instruments (Fig 1), part of observation raw and processed data are supplid by Central Weather Bureau (Table 1), the reset of observation raw data supplied by other institutions are listed in Table 2.
Moreover, the data in Table 1 and Table 2 can be downloaded from data server built by Central Weather Bureau.
Tabel 1. The brief infomation of data supplied by Central Weather Bureau.
Observation Instrument |
Variables |
Frequency (min) |
Note |
|---|---|---|---|
Satellite |
Infrared, Visible |
Taiwan area: 10 East Asia: 30 |
|
Radar C band (Raw) |
dBuZ, dBZ, KDP, PhiDP, RhoHV, SNR, SQI, uPhiDP, V, W, ZDR |
< 10 |
|
Radar S band (Raw) |
dBZ, V, W, …. |
< 10 |
|
Radar X (Raw) TEAM-R |
< 10 |
||
Radar(Processed) |
Mosaic 2D, Mosaic 3D, QPE 1 hour |
||
Disdrometer |
Particle Size, Particle speed, Rainrate intensity |
1 |
|
Sounding |
< 1 |
||
Surface |
10 and 15 |
||
Wind profiler |
6 |
||
Lightning |
Inner Cloud, Cloud to Ground, Flash Time |
< 1 |
Tabel 2. The brief information of data not supplied by Central Weather Bureau
Observation Instrument |
Variables |
Frequency (min) |
Institution |
|---|---|---|---|
Radar S band (Raw) SPOL |
dBZ, V, W, …. |
< 10 |
NCAR |
Radar X (Raw) TEAM-R |
< 10 |
NCU |
|
Sounding |
wind speed, wind direction, … |
< 1 |
PCCU, NCAR |
Storm Tracker |
wind speed, wind direction, … |
PCCU |
NCAR: National Center For Atmospheric Research NCU: National Central University PCCU: Chinese Culture University